Taxes#101 of 102 · Added July 22, 2026
Federal Dependence
Federal spending received minus federal taxes paid, per resident
Data: Rockefeller Institute of Government, 2023 ↗nhmaps.com/60
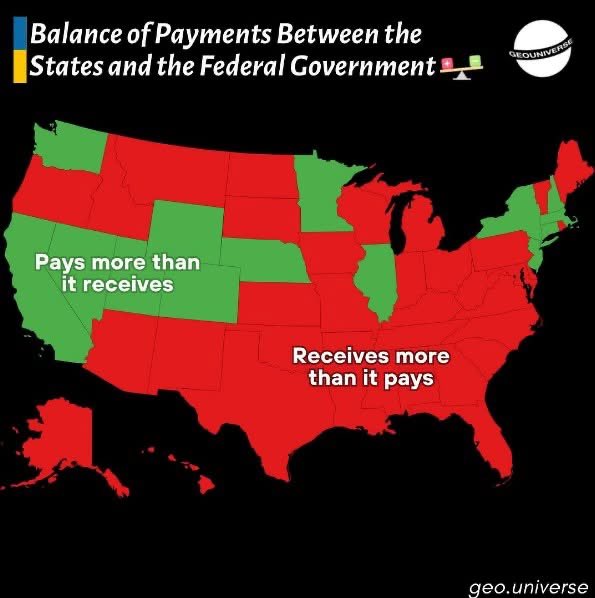
New Hampshire pays in more than it gets back... wait is that good? Give us our money back!
Balance of payments with the federal government per capita (federal spending received minus federal taxes paid), FFY 2023 (net dollars per resident)
Source & data: Rockefeller Institute of Government, 2023 ↗Found via @GregMooreNH ↗
View the data (50 states)
| # | State | Value |
|---|---|---|
| 1 | New Jersey | $-2,011 |
| 2 | Massachusetts | $-967 |
| 3 | Washington | $-7 |
| 4 | New Hampshire | $23 |
| 5 | California | $342 |
| 6 | New York | $674 |
| 7 | Minnesota | $807 |
| 8 | Illinois | $818 |
| 9 | Colorado | $1,051 |
| 10 | Utah | $1,067 |
| 11 | Nevada | $2,120 |
| 12 | Nebraska | $2,351 |
| 13 | Florida | $2,574 |
| 14 | Texas | $2,603 |
| 15 | North Dakota | $2,787 |
| 16 | Wisconsin | $2,887 |
| 17 | Connecticut | $2,937 |
| 18 | Wyoming | $3,218 |
| 19 | Iowa | $3,481 |
| 20 | South Dakota | $3,626 |
| 21 | Kansas | $3,900 |
| 22 | Georgia | $3,951 |
| 23 | Idaho | $4,191 |
| 24 | Oregon | $4,389 |
| 25 | Indiana | $4,415 |
| 26 | Michigan | $4,584 |
| 27 | Tennessee | $4,589 |
| 28 | Rhode Island | $4,767 |
| 29 | North Carolina | $4,808 |
| 30 | Pennsylvania | $4,826 |
| 31 | Montana | $4,929 |
| 32 | Ohio | $5,075 |
| 33 | Delaware | $5,360 |
| 34 | Vermont | $5,558 |
| 35 | Missouri | $7,150 |
| 36 | Arizona | $7,195 |
| 37 | Arkansas | $7,340 |
| 38 | South Carolina | $7,926 |
| 39 | Oklahoma | $8,097 |
| 40 | Louisiana | $8,784 |
| 41 | Maine | $9,144 |
| 42 | Alabama | $10,268 |
| 43 | Hawaii | $10,291 |
| 44 | Kentucky | $10,813 |
| 45 | Mississippi | $11,714 |
| 46 | West Virginia | $12,130 |
| 47 | Maryland | $13,037 |
| 48 | Alaska | $14,760 |
| 49 | New Mexico | $16,178 |
| 50 | Virginia | $16,650 |